


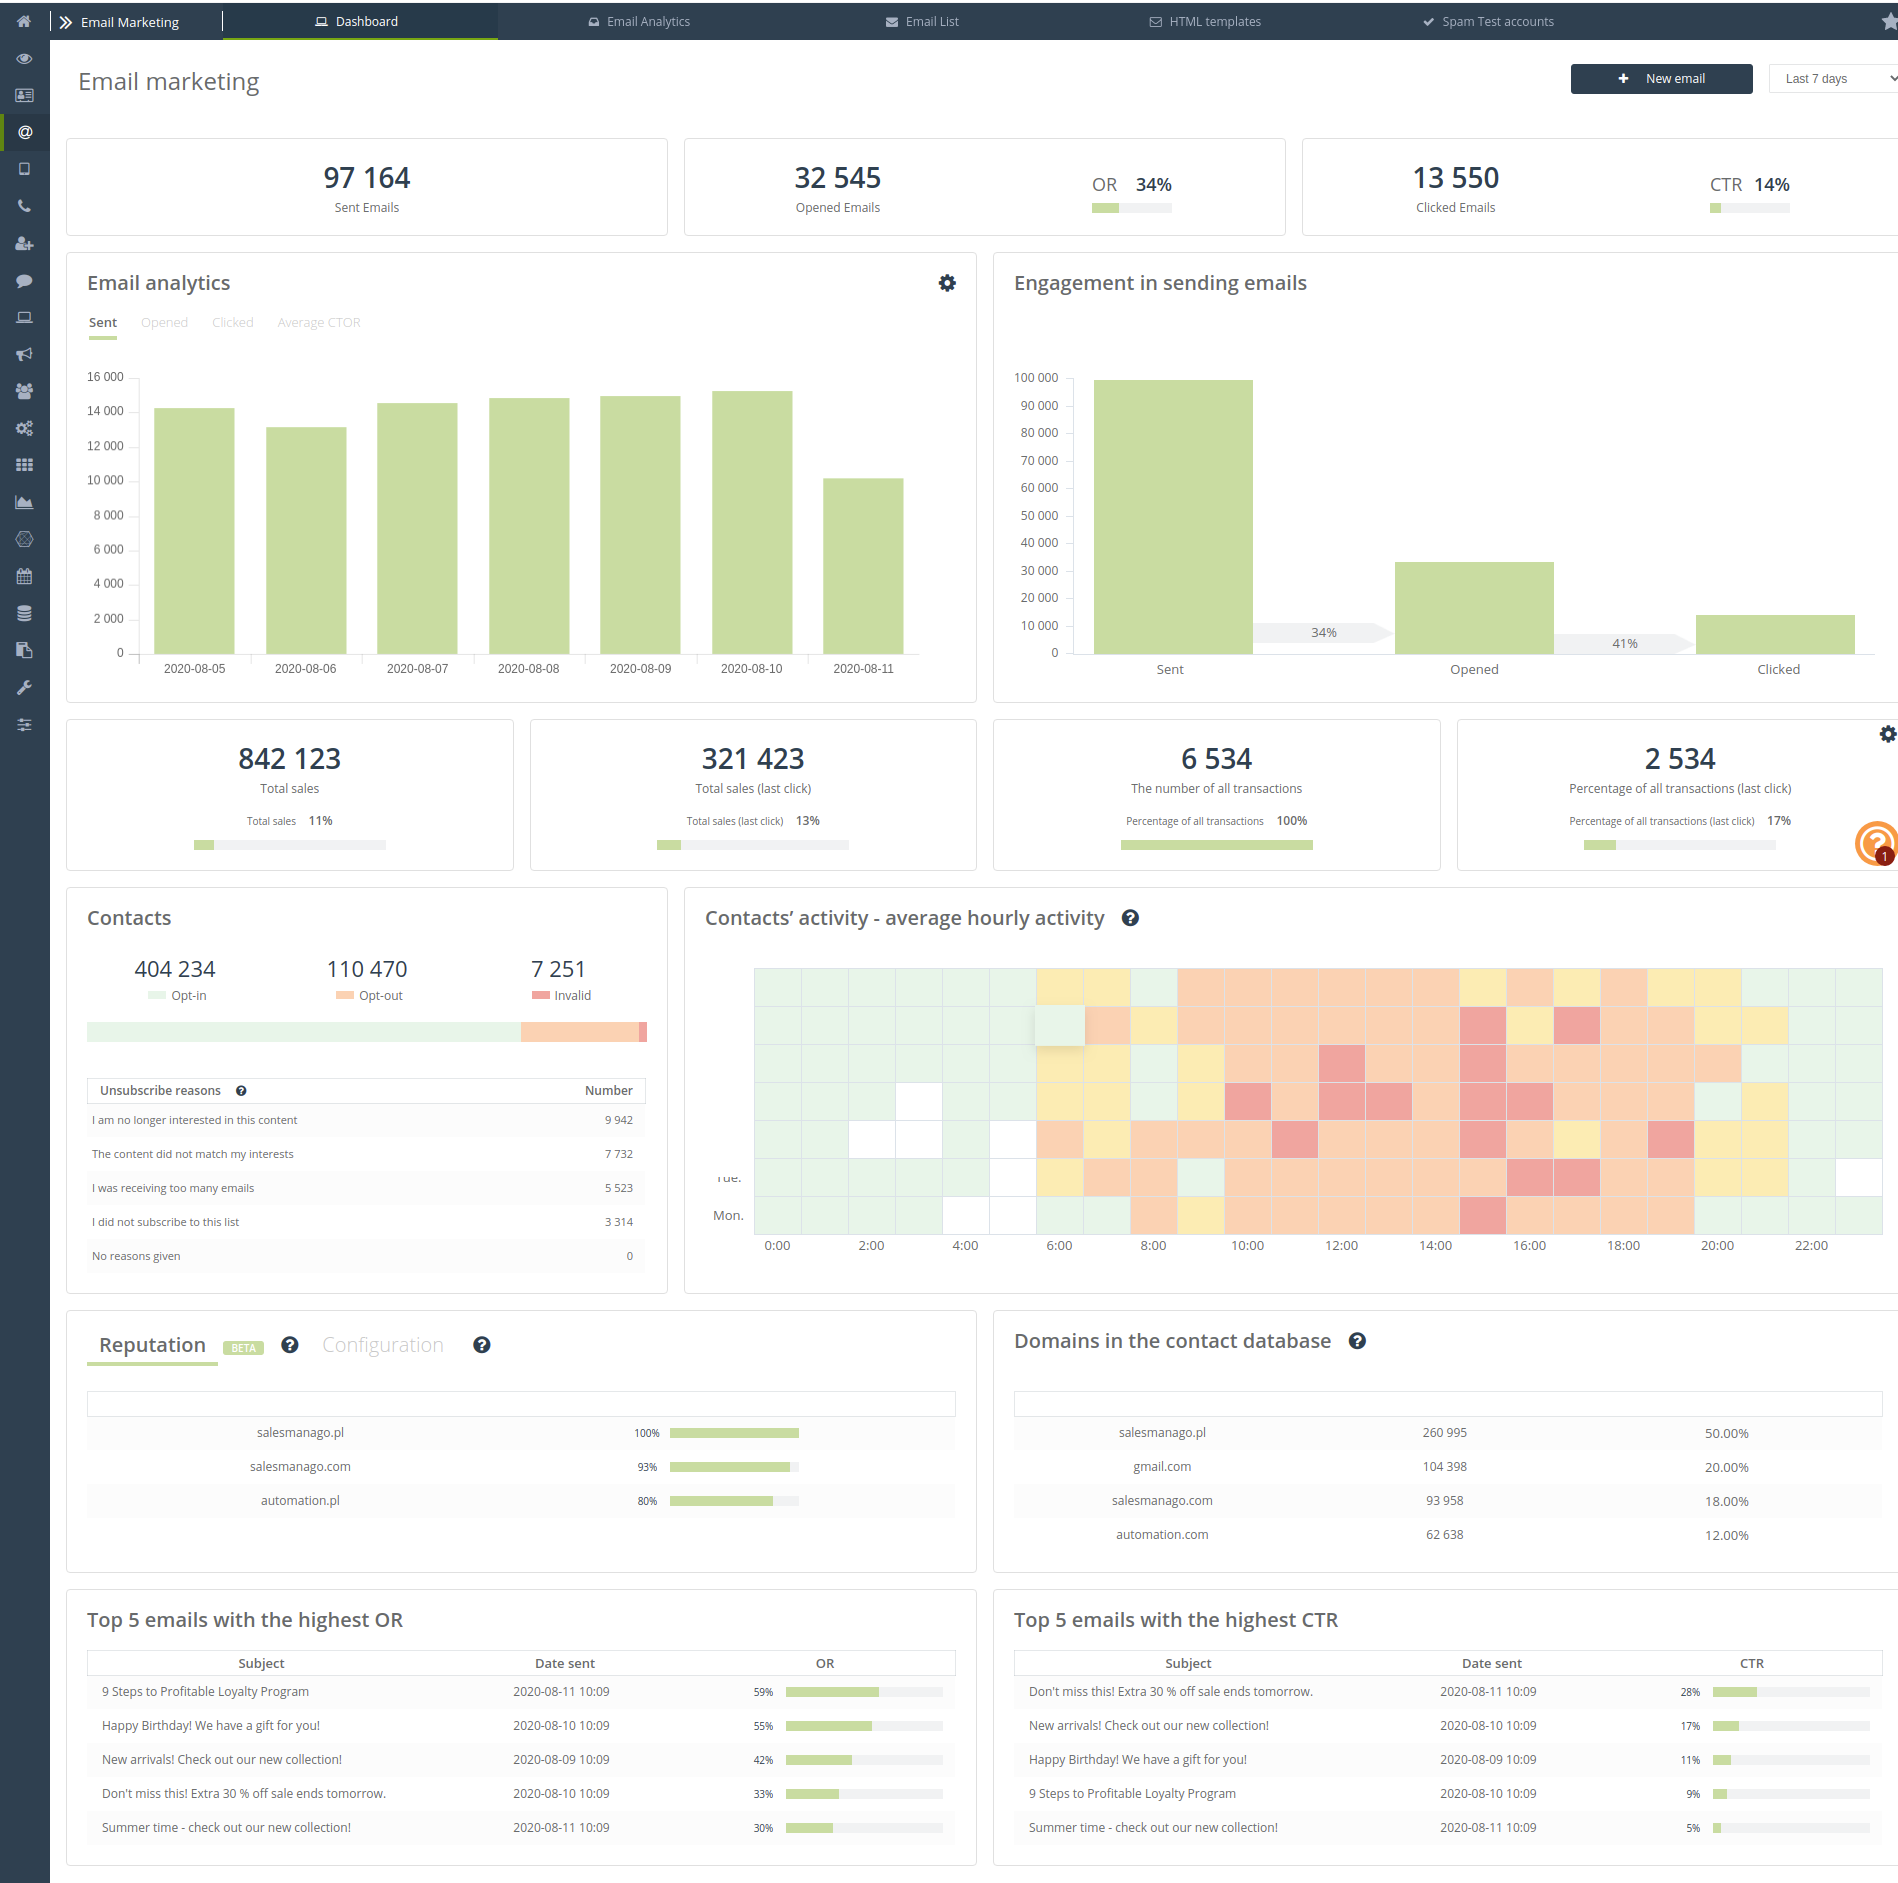
The Email Marketing Dashboard presents detailed statistics of all your email campaigns. Using the analytics of your contacts’ activity, you can determine the best time to send mailings. Manage the deliverability of your campaigns to improve your OR and CTR statistics, measure revenues and analyze orders generated thanks to the sent emails and newsletters from SALESmanago.
Use the database status analytics along with a full list of reasons for unsubscribing in order to better manage contacts and improve the quality of campaigns.
To open the Email Marketing Dashboard, go to:
Email Marketing → Dashboard
Contents
- Basic information
- Email analytics
- Engagement in sending emails
- Sales/transactions
- Contacts
- Contacts’ activity
- Reputation/configuration
- Domains in the contact database
- Top 5 emails
1. Basic information
In the Email Marketing Dashboard, you will find basic statistics about email campaigns.

[1] +New email – Click the button to compose an email using Email Designer or HTML Creator.
[2] Time period – Select the time period for which information will be displayed. The available options are last 7 days, last 30 days, current month, previous month, current quarter, previous quarter, current year, previous year and last 12 months.
[3] Sent emails – The total number of messages sent from the account within the specified time period.
[4] Opened emails – The total number of messages sent from a given account that were opened by their recipients in the selected time period. The total OR indicator is also shown here – i.e., open rate, showing the ratio of the number of unique openings of a message to the number of messages sent, expressed in a percentage (excluding soft and hard bounces).
[5] Clicked emails – The total number of messages sent from a given account in which the link or links contained in the mailing content were clicked on by the recipient in the selected time period. The total CTR indicator is also shown here – i.e., the click-through rate, which shows the ratio of the number of unique clicks on a message to the number of messages sent, expressed in a percentage (excluding soft and hard bounces).
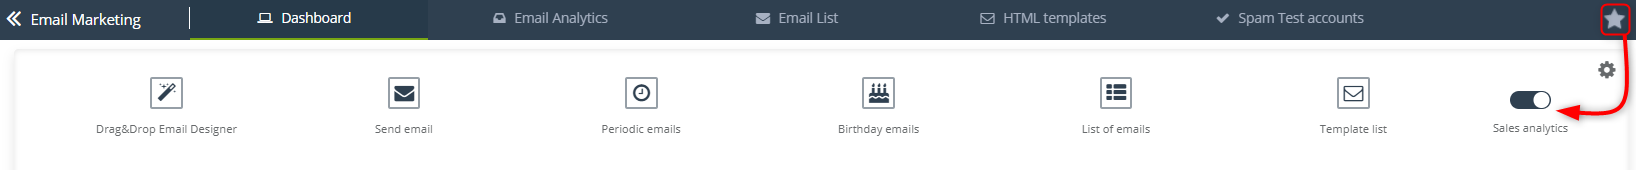
IMPORTANT: There is a star icon on the top menu of the tab bar. This will direct you to quick links:
-
- Drag & Drop Email Designer
- Send email
- Periodic emails
- Birthday emails
- List of emails
- Template list
You can freely move these elements among themselves and turn them on and off.
Additionally, from here you have the option to disable Sales Analytics on the Dashboard:
2. Email analytics
The Email analytics section provides graphical information about the number of emails sent, opened and clicked, as well as the average CTOR.
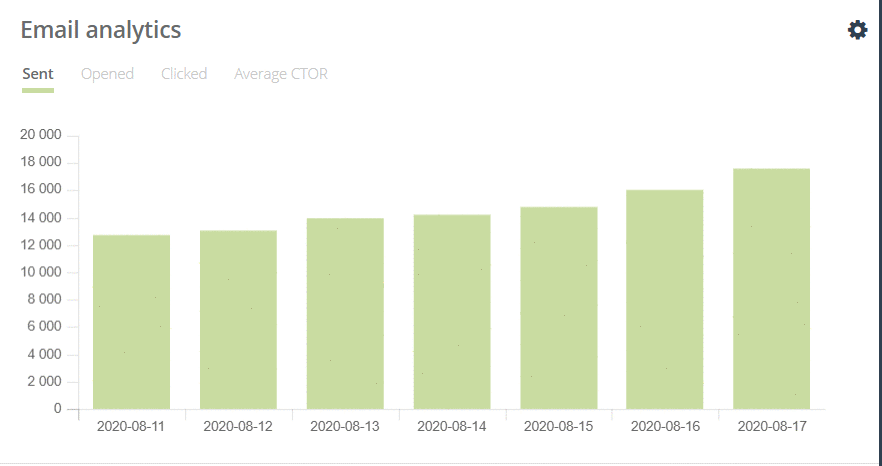
CTOR is the ratio of the number of unique message clicks to the number of unique message openings, expressed as a percentage.
You can select the type of chart presenting analytical data by clicking on the window settings icon. You have the option of a line chart or a bar chart:

3. Engagement in sending emails
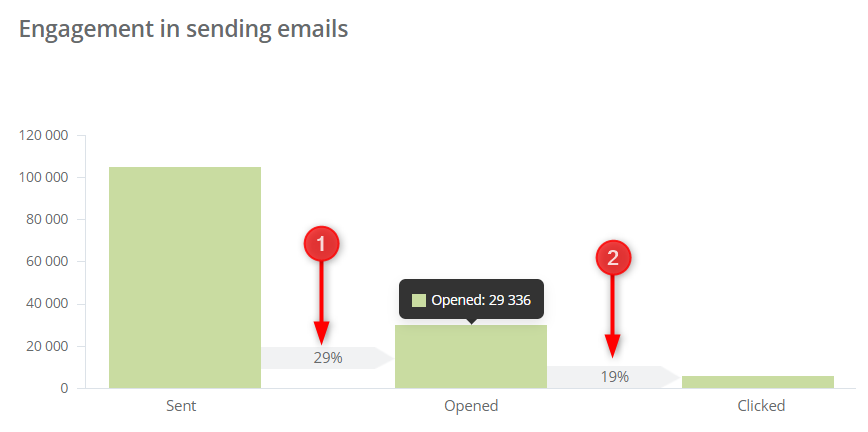
The Engagement in sending emails tile shows the total number of messages sent [1], the percentage of sent messages that were opened [OR], and the percentage of clicked links from opened messages [CTOR] [2]. This section of the Email Marketing Dashboard allows you to determine whether your mailings are effective and bring in the desired results.
4. Sales/Transactions
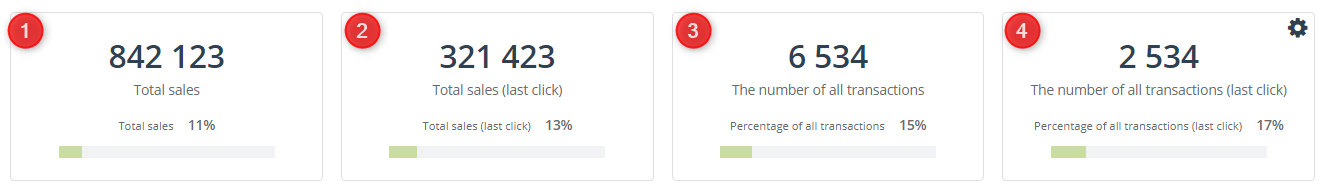
Here you can view the total sum of sales originating from mailings for the selected time period.
IMPORTANT: Emails sent using the Automation Rules and Workflow are not included in the above statistics.
[1] Total sales – The total amount of revenue from purchases made using mailings from the Email Marketing module.
[2] Total sales (last click) – The total amount of revenue from Email Marketing, when an email is the last source of the contact’s entry to the website after which the transaction was made.
[3] The number of all transactions – The total number of transactions completed using a mailing from the Email Marketing module.
[4] The number of all transactions (last click) – The total number of purchases made from Email Marketing, when email is the last source of the contact’s entry to the website after which the transaction was made.
5. Contacts
In the Contacts tile of the Email Marketing Dashboard you can find information about contact statuses, which are constantly updated, and the reasons for users unsubscribing from the database from the last 90 days:
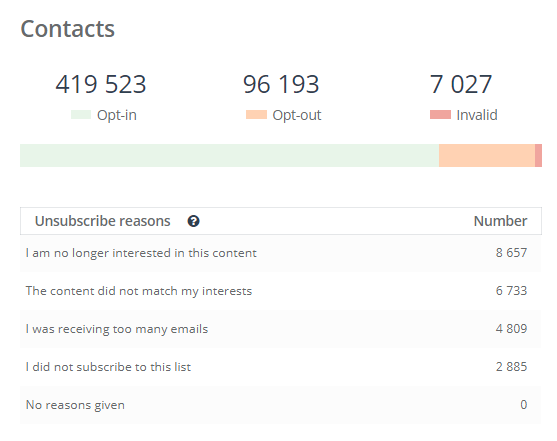
You can analyze the reasons for unsubscribing from the contact database in order to make changes to your mailings in the future and reduce the number of customers unsubscribing.
The opt-in status is assigned to contacts who signed up for the subscription. In the SALESmanago system, we distinguish customers who, among other things, have an opt-in email status, which means that you can send mailings to a given contact.
The opt-out status is assigned to contacts who have unsubscribed. In the SALESmanago system, we distinguish customers who, among other things, have an opt-out email status, which means that it is not possible to send email messages to the contact.
Invalid is the status of a contact who does not receive email messages for various reasons, such as:
- Soft bounce – Occurs when message delivery is impossible. With soft bounces, the reason for not delivering the message to the client is temporary (e.g., the recipient has a full mailbox). The message may be correctly delivered the next time you try to send it.
- Hard bounce – An auto-responder email sent by the mail server to the sender informing them that the message could not be delivered. The reason may be an incorrectly entered or nonexistent email address.
6. Contacts’ activity
The activity of contacts is based on the analysis of the last 3 weeks of customer interaction with emails received. When calculating activity percentage results, clicks and mailings opened at a given time are taken into account.
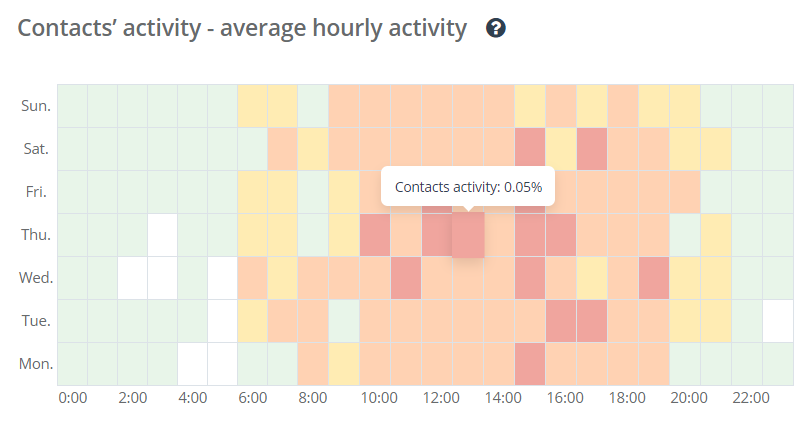
For example, let’s suppose the percentage of the Friday 12:00 tile is 5. This means that 5% of the total number of clicks and openings in the last 3 weeks happened on that day of the week at 12:00.
7. Reputation/Configuration
The reputation of the mailing domain is directly correlated with the quality of the mailings you send and how the mail programs interpret them – that is, whether or not they are user-friendly.
The higher the reputation level, the better. Our original mechanism calculates reputation based on the collected data about sent mailings.
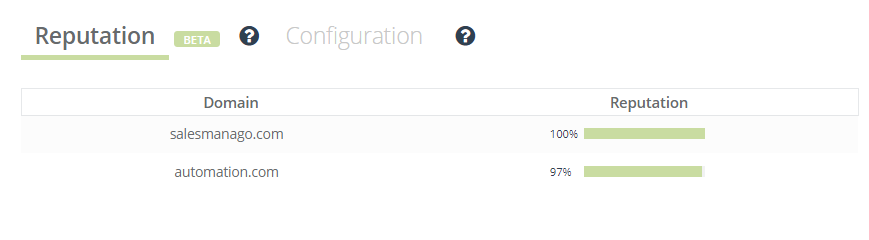
In the tile, you will also see information about configurations for your available domains:
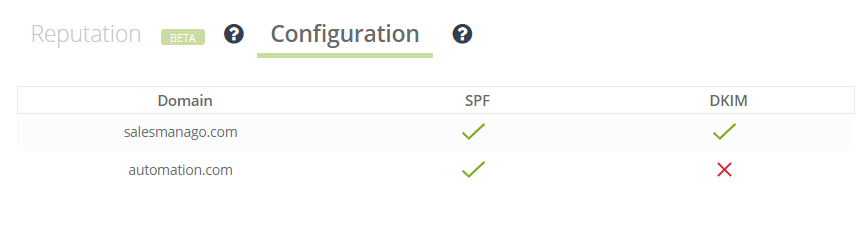
- DKIM – A method of linking a web domain to an email, enabling an organization to take responsibility for the content of the email. A DKIM signature prevents the sender from being falsely impersonated.
Check how to configure the DKIM key >>
- SPF – Its purpose is to protect mailing servers from receiving mail from unauthorized sources to reduce the amount of spam.
Check how to configure the SPF key >>
8. Domains in the contact database
In the Email Marketing Dashboard, you have access to your contact database separated by email address domains, along with how many contacts are in each domain and the percentage of contacts in each domain in relation to all contacts in your database.
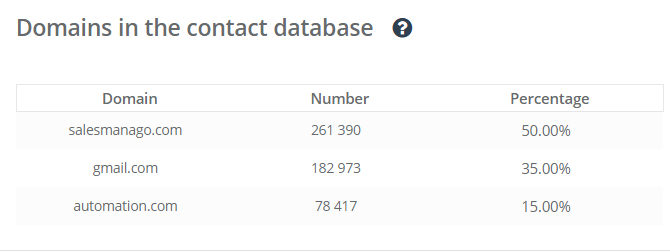
Remember that by sending, for example, a mailing to 1,000,000 contacts from @gmail.com, you may lower your mailing domain’s reputation. This is because Google may treat these messages as spam.
IMPORTANT: It is worth having several email addresses with different domains and sending more personalized email campaigns. At SALESmanago, we do not recommend sending one mailing to the entire contact database.
9. Top 5 emails
At the very bottom of the Dashboard, you can see which of your mailing campaigns were the most effective:
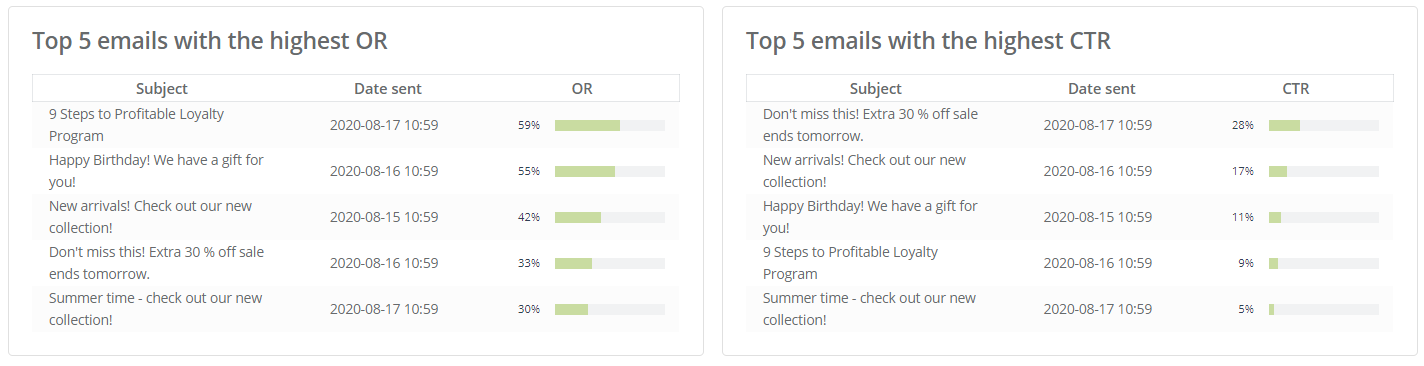
Top 5 emails with the highest OR – The top 5 messages with the highest OR indicator will be displayed here – i.e., open rate, showing the ratio of the number of unique openings to the number of messages sent, expressed in a percentage (excluding soft and hard bounces). These are mass messages and messages sent in the form of A/B tests.
Top 5 emails with the highest CTR – The top 5 messages with the highest CTR will be displayed here – i.e., click-through rate, showing the ratio of the number of unique clicks on a message to the number of messages sent, expressed in a percentage (excluding soft and hard bounces).
IMPORTANT: You can see a detailed analysis of a given mailing by hovering your mouse over the message.