


Useful links
Lead Generation Analytics enable you to analyze the source of the contact acquirement. If, for example, on a monitored website you have a couple of places where an anonymous contact can leave his email address (while downloading an e-book, signing up for a newsletter, registration) you will be able to identify the source through which a contact entered SALESmanago System.
CASE STUDY:
An anonymous contact can leave his email address to download an e-book (assign tag: e-book), download case study (assign tag: case study), sign up for a newsletter on a pop-up (assign tag: pop-up).
During one visit, an anonymous contact leaves his email address in 3 places. In the beginning an anonymous contact was interested in an e-book only. Then, he read it and downloaded case study and in the end signed up for subscription.
Three tags have been assigned to a contact: e-book, caste study, pop-up.
Thanks to lead generation analytics you can classify contacts as gained through downloading an e-book (the contact download e-book therefore he entered the system). In such analytics the contact are not classified with pop-up and case study tags, because the contacts was not gained through those channels.
Benefits from using lead generation analytics:
You will be able to find out which source is the most effective. What is more, you will be able to analyze the retention of all the actions connected to gaining customers.
Note: the source of the customer acquirement is defined as tag. Every automatically assigned tag can be perceived as the source of the customer acquirement.
LEAD GENERATION Analytics – description
Lead generation analytics can be found in menu in HOME -> DASHBOARDS -> LEAD GENERATION ANALYTICS -> ADD NEW DASHBOARD
Click “add new dashboard’ to move to the following screen:
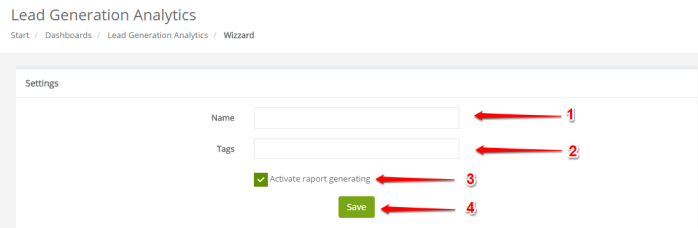
[1] Name – type the name of the report.
[2] Tags – provide tags that are the source of customers acquirement. You can type just first three letters and the tags options will show up. There is no limit, you can provide as many tags as you wish. The tags will be then analyzed on a basis of their effectivity in gaining customers.
[3] Activate report generating – if you check this box and click Save [4] the process of generating report will begin. The report will then be ready for the following day. If you set the report this way it won’t be able to be edited.
To delay report generation and be able to edit it later, do not check the check box “activate report generating” and click Save [4].
If you click SAVE you will be redirected to the screen with the collection of lead generation reports.
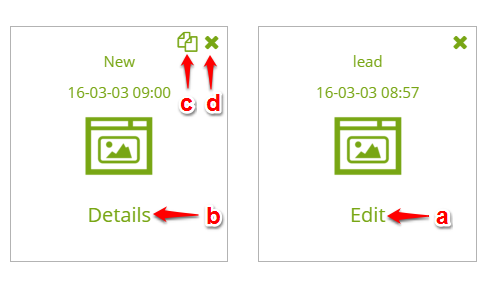
[a] Edit – the report, that hasn’t been activated for generating can be edited. To activate the report click on it. You will be redirected to the settings where you need to check the checkbox and then activate report generating.
[b] Details – click on details and you will be redirected to the full report.
[c] Copy – once the report has been generating you can copy it and edit that copy. Thanks to such option you do not have to start doing the report form the beginning when you only wish to change one detail. Copied and edited report will be ready for the following day.
[d] Delete – click „X” to delete report.
Note: the analytic dashboard is generated once a day (at night), therefore after being set it will be available on the following day. The data are is also counted once a day.
Report Data
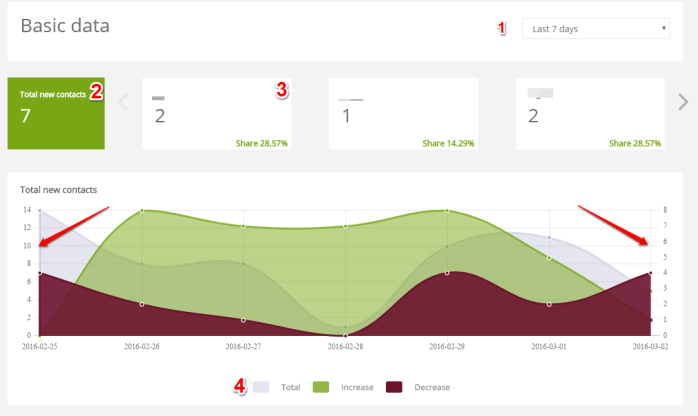
[1] Time period – choose the time period to view the statistics below.
[2] Total new contacts – the total for all the contact gained through different sources of contacts acquirement (tags).
[3] boxes with tags – every box shows the source of the contact acquired (one box = one tag). Also you can find the comparison of one tag to the new contacts (first box).
[4] The diagram below – presents:
- total contacts – the general contacts gained through different sources (from the moment the sources were provided for the first time).
- increase – the number of contacts gained in a chosen time slot.
- decrease – the number of the deleted contacts or contacts with deleted tags.
One diagram shows details for one box – new contacts and for each tag separately. Select from which box you want to view data.
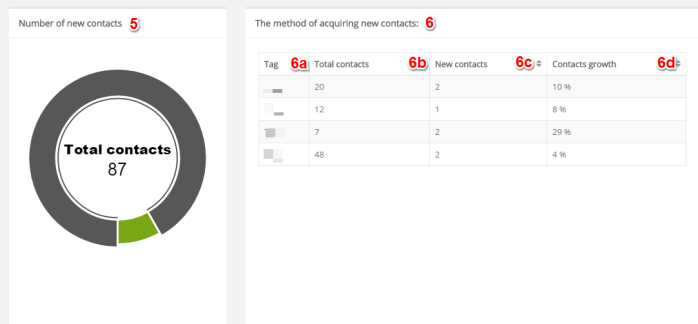
[5] Number of new contacts – the diagram shows the number of all the contacts gained through different sources.
[6] The method of acquiring new contacts – this section consist of:
- [6a] tags – the list of all the sources of acquiring contacts (tags),
- [6b] total contacts – the number of the contacts acquired through a particular tag (in general),
- [6c] new contacts – the number of contacts acquired through a particular tag (in a specific time period),
- [6d] contacts growth – the value (in percentage) that shows the growth of the contacts acquired through a particular tag in a specific time period.
Submit your review | |