


Useful links
SALESmanago can greatly simplify communication with clients. One way of improving the way your campaign functions is to take a good look at how your automation rules perform. To begin, go to:
Start > Automation Processes > Dashboard
The Automation Processes screen will appear. Here you can access several key statistics.
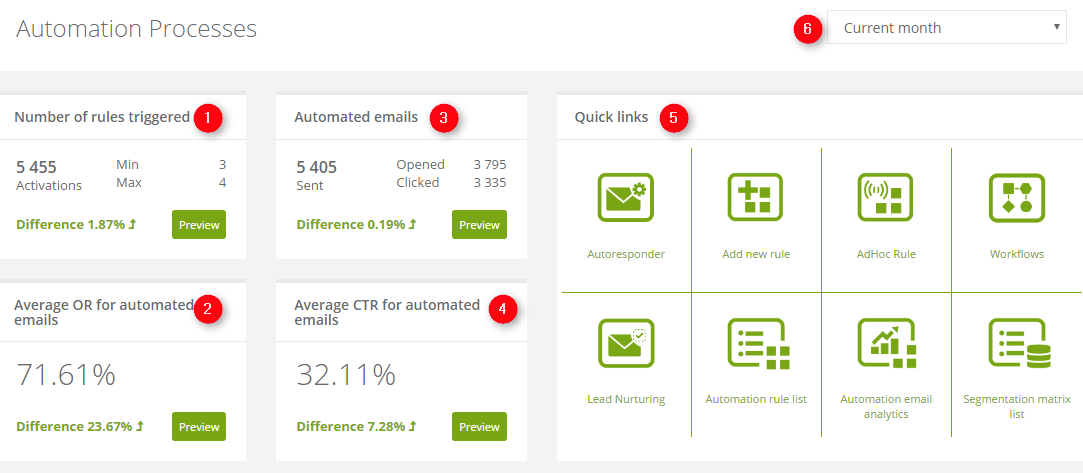
[1] Number of rules triggered – the total number of rule activations for a defined time period. The Min and Max values refer respectively to the worst and best performing rules and their activation count. The difference shows how performance has changed between the set time period and the one before it,
[2] Average OR for automated emails – average open rate for messages sent by automation rules, for a defined time period. The difference shows how OR has changed between the set time period and the one before it,
[3] Automated emails – the total number of sent, opened and clicked automated messages, for a defined time period. The difference shows how the number of sent messages has changed between the set time period and the one before it,
[4] Average CTR for automated emails – average click through rate for messages sent by automation rules, for a set time period. The difference shows how CTR has changed between the set time period and the one before it.
[5] Quick links – easy access to key functions,
[6] Time period – using this Drop-Down Menu you can set the time period for which you want the data to be displayed,
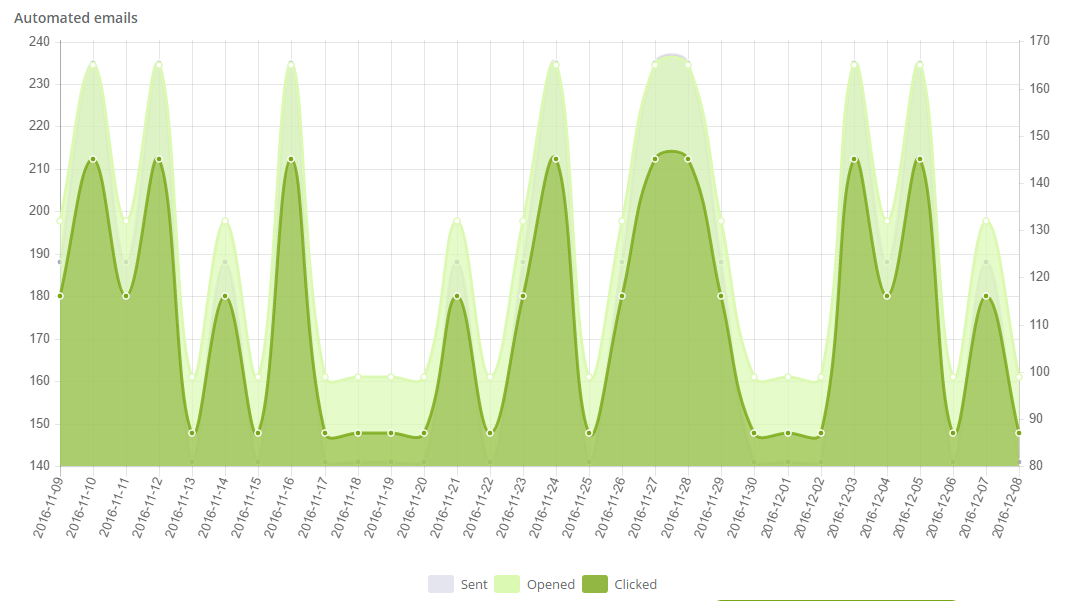
Preview – clicking this button will cause the chart below to update for selected variables. Below you can see an example chart display for Automated emails.
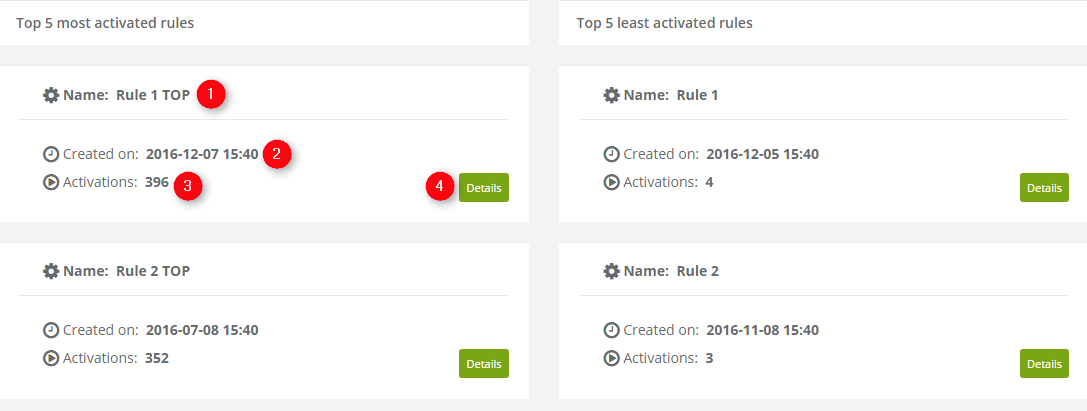
Top 5 most/least activated rules – here you can see rules that activate the most and the least in two columns.
[1] Rule name,
[2] Date of creation,
[3] Number of times the rule activated,
[4] Details – clicking this button will open a window with detailed information on the rule,
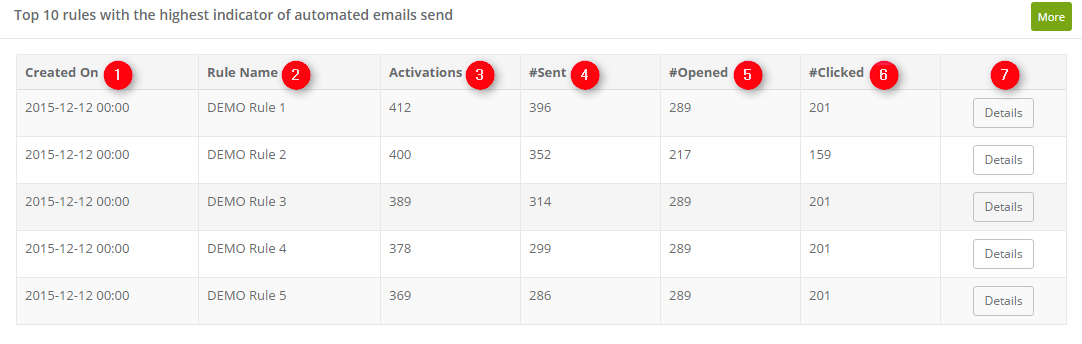
Top 10 rules with the highest indicator of automated emails sent – on this list, you can find rules that send the most emails. You can manage their settings by clicking the More button in the upper right corner.
[1] Date of creation,
[2] Rule name,
[3] Number of times the rule activated,
[4] Number of messages sent by the rule,
[5] Number of messages sent by the rule, which were opened,
[6] Number of messages sent by the rule, which were clicked,
[7] Details – this button opens analytics for a specific rule,
Rule details – in this section, you can review data on a specific rule, turn it on and off, export it, edit its settings and preview email templates used by the rule.
To learn how to use this part of the system click here >>
Submit your review | |